House prices: the Office for National Statistics’ hedonic model
Using geospatial data to assess how housing prices are affected by the surrounding environment
The challenge:
House prices are impacted by a number of factors, including location, building characteristics, and the surrounding environment.
To estimate the impact that these factors have on house prices, ONS wanted to develop a hedonic pricing model using geospatial data to assess which features impact prices.
In their previous model, ONS used data extrapolated from the property website, Zoopla, as well as machine learning, to estimate the impact of green and blue space on house prices. But this extrapolated data was becoming increasingly outdated and failed to reflect potential annual changes.
The main challenge was being able to gather recent geospatial data on various features which may impact house prices. Additionally, the task at hand involved a substantial amount of data, as each individual residential property would need to be examined.
"OS helped fill data gaps in our move to administrative data sources, enabling us to better understand the role of public and private greenspace on house price and achieve our ambition of producing more granular data for users. "
The solution:
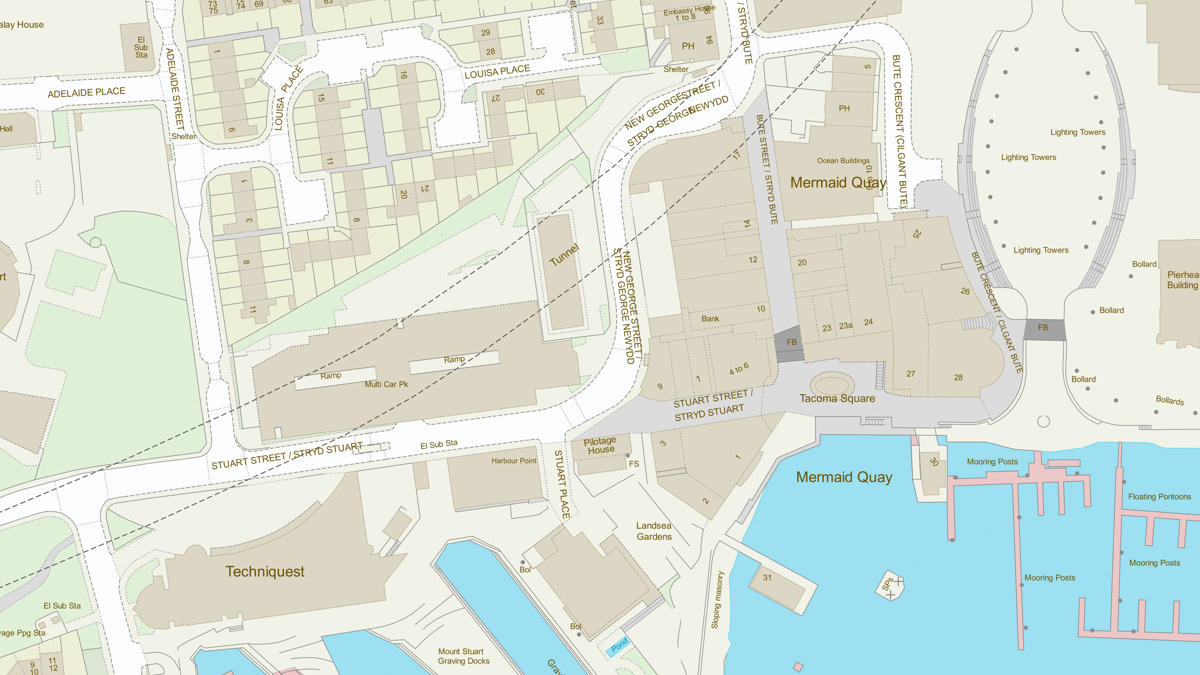
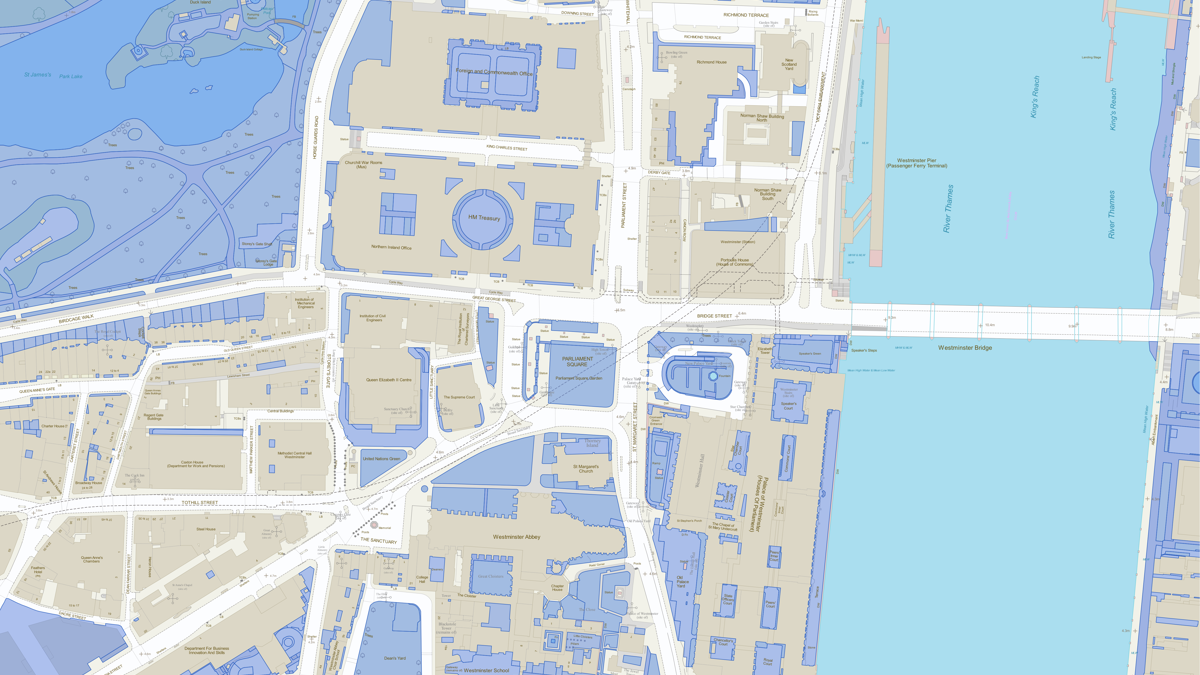
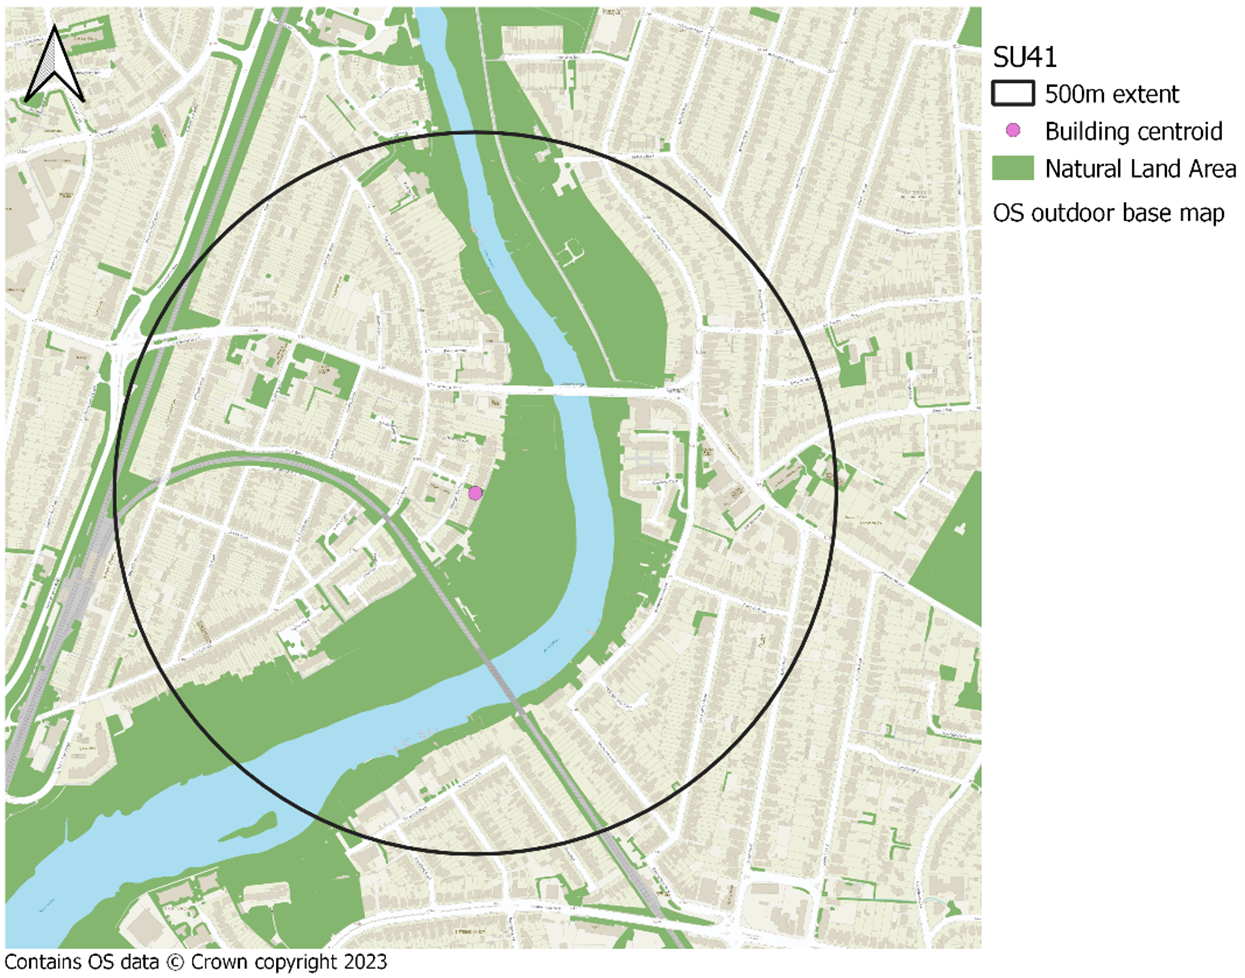
ONS worked with Ordnance Survey (OS) to conduct the geospatial analysis that would feed into the new hedonic house price model. ONS provided a list of features they believed would impact house prices. This includes natural land cover, blue space, garden size, house orientation, coastline, railway stations, railway line, bus stops & stations, retail sites, national grid infrastructure, sewage works, prison, wind turbines, airport, hospitals, & waste centres.
A mixture of OS datasets/data were used to locate these features, including OS MasterMap Topography Layer, OS NGD Land Use Theme, OS NGD Structures Theme, and OS NGD Land Theme. Two experimental datasets were utilised – these were retail clusters that were generated for a project in March 2020, and buildings data that contained some addressing information (to be released within NGD).
OS data scientists used OS data to extract these features, and then calculated the Euclidean distance from each residential building to the closest features. The distance was then disaggregated to UPRN level by applying the building value to all UPRNs within the building.
The benefits:
With OS’ new data serving, ONS are now able to create maps and statistics on house prices by geographical area, without having to rely on commercial data. The insights uncovered by the hedonics analysis will also help planners understand how to maximise the benefits of public greenspace in urban areas.
Further support
For further help about how our data can transform your organisation, contact us today

Our highly accurate geospatial data and printed maps help individuals, governments and companies to understand the world, both in Britain and overseas.
Products and solutions featured in this blog
OS MasterMap Topography Layer
A map dataset of Great Britain's landscape – from roads to fields, to buildings and trees, fences, paths and more.
OS NGD API – Features
Perform powerful geospatial analysis. Filter the data to receive exactly what you need, as and when you need it.